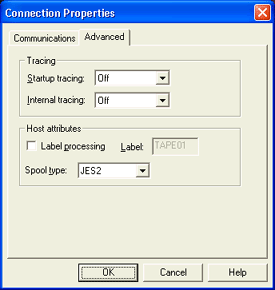
Use this dialog box to set advanced connection properties. You can access this tab by selecting Connection | Add or Modify on the menu bar. You can also right-click the connection and select Add or Modify.
Click an option you want to learn more about.

You must be a member of the local Administrators
group to capture a trace.
Tracing may cause performance degradation and should only be used for troubleshooting
purposes.
Startup tracing – Starts tracing the network and channel adapter automatically when a connection is started. The trace file is saved in the \\Program Files\Common Files\Barr\Trace folder. The trace file name will be the name of the service, with an .ipt extension for network traces and a .chi extension for channel traces. Each connection is saved as a Windows service. Services are named as follows, BarrTOSAdapterNumber_ImageNumberChannelAddress (for example, BarrTOS0_00E). If you are using a Bus & Tag adapter, the image number will not appear.
After you capture the trace, you can use the Diagnostics Utility to send the file to Barr Systems Technical Support.
Off – Disables startup tracing. This is selected by default.
Short – Automatically starts a short network and channel trace when the connection is started. This trace provides general information.
Long – Automatically starts a long network and channel trace when the connection is started. This trace provides detailed information.
Internal tracing – Captures internal trace information in a trace file. The trace file is saved in the \\Program Files\Common Files\Barr\Trace folder. The trace file name will be the name of the service, with a .int extension. Each connection is saved as a Windows service. Services are named as follows, BarrTOSAdapterNumber_ImageNumberChannelAddress (for example, BarrTOS0_00E). If you are using a Bus & Tag adapter, the image number will not appear.
After you capture the trace, you can use the Diagnostics Utility to send the file to Barr Systems Technical Support. This option should only be enabled if a Barr Systems support analyst advises you to do so. This option is disabled by default.
Off – Disables tracing. This is selected by default.
On – Captures a trace of the internal state of the system.
Label processing – Indicates the software will emulate a labeled tape.
Label – Specifies the VOLSER Volume serial number. of the tape label if label processing is enabled. The default value is TAPE01.
Spool type – Specifies the type of host spooler from which you will be receiving data. You can select either JES2 or POWER. When using POWER, the process on the host must be manually started for each batch of jobs. When using JES2, the process can be fully automated. JES2 is selected by default.