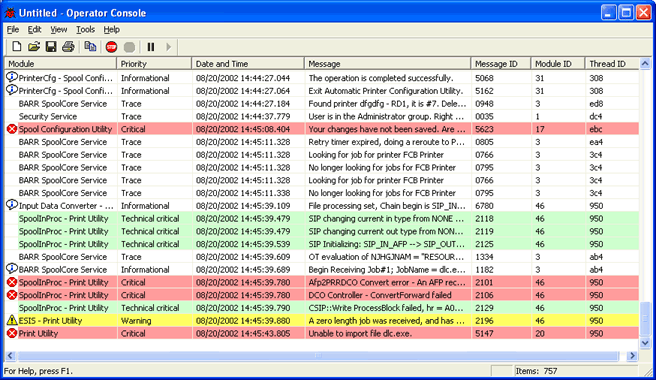
Use the Operator Console to gather information about program activity. Use the console as a journaling tool to record and display activity that occurs during normal program operation. The console effectively traces program code by recording a priority level and filtering modules and messages.
Click the portion of the window you want to learn more about.

The menu bar displays below the title bar. Click the following menus to learn about the available commands.
New– Creates a new log file.
Open– Opens an existing log file (.bdb). This command displays the Open dialog box so you can choose the log file to open. The log file will open in Operator Console in a read-only format.
Save– Saves the active log file (.bdb) to its current name and directory. When you save a log file for the first time, Operator Console displays the Save As dialog box so you can name it. If you want to change the name and directory of an existing log file before you save it, choose the Save As command.
Save As– Saves and names the active log file. Displays the Save As dialog box so you can name your log file. To save a log file with its existing name and directory, use the Save command.
Close– Closes the open log file and displays the active log file.
Print–Prints the contents of the console window. This command displays a Print dialog box where you can specify the range of pages to print, the number of copies, the destination printer, and other printer setup options.
Print Preview– Displays the contents of the console window as it looks when printed. A print preview window displays in which one or two pages display in their printed format. With the print preview toolbar you can view one or two pages at a time, move back and forth through the document, zoom in and out of pages, and initiate a print job.
1, 2, 3, 4– Opens the last four log files you closed. Choose the number that corresponds with the log file you want to open.
Exit– Closes the Operator Console window. Operator Console prompts you to save changes to the current log file.
Copy– Copies the selection to the Clipboard. Copying data to the Clipboard replaces the contents previously stored there.
Select All– Selects all of the records in the console.
Sort By Time– Sorts trace data on the console by date and time.
Find– Searches all entries for the specified text.
Find Next– Searches for the next occurrence of the specified text.
Find Previous– Searches for the previous occurrence of the specified text.
Toolbar– Displays or hides the toolbar. A check appears next to the menu item when the toolbar is displayed.
Status Bar– Displays or hides the status bar. A check mark appears next to the command when the status bar is displayed. The left side of the status bar describes the action to be carried out by the selected command or toolbar button. The right side indicates the number of records displayed in the console window.
Stop– Stops all data from appearing on the console. When a log file is read-only, this option is not available.
Go– Starts the streaming of data in the Operator Console window. Use this after the Stop option. When a log file is read-only, this option is not available.
Pause– Pauses the console scroll in the Operator Console window. Allows you to pause the console to view a specific message.
Resume– Resumes scrolling in the Operator Console window. Use this after the Pause option.
Message Details– Displays the entire text of an Operator Console message.
Gridlines– Displays or hides the console gridlines. A check appears next to the menu item when the gridlines are displayed. By default this option is selected.
Options– Selects program modules and sets the module-specific priority levels of the records that will appear on the console. Records will be displayed for selected modules which have a priority level less than or equal to the value selected. Displays the Options dialog box.
Contents and Index– Displays the Operator Console Help window. The Help window incorporates contents, index, search, favorites, and glossary tabs to make it easy for you to find answers to your questions. For more information on using Help features, see the Using the Help topic.
Barr Systems on the Web– Opens the Help with links to the Barr Systems Web page.
About Operator Console– Displays program information, version number, and copyright.
The toolbar provides quick access to commands. To hide or display the toolbar, on the menu bar, select View | Toolbar. To move the toolbar, click the toolbar and drag it to a new location.

New – Opens a new log file.
Open – Opens an existing log file.
Save – Saves the log file with its current name and location.
Print – Prints the contents of the console window.
Copy – Copies the selection to the Clipboard.
Stop – Stops all data from appearing on the console. When a log file is read-only, this option is not available.
Go – Starts the streaming of data in the Operator Console window. Use this after the Stop option. When a log file is read-only, this option is not available.
Pause – Pauses the console scroll in the Operator Console window. Allows you to pause the console to view messages.
Resume – Resumes scrolling in the Operator Console window. Use this after the Pause option.
The Operator Console window displays these columns for traced data. The fields are presented under column headings in the Operator Console window. The columns can be resized to accommodate the size of the field. Operator Console messages are sorted by the date and time they are received. The most recent messages appear at the bottom of the window.
If the Operator Console has been configured to capture a trace, the history will be displayed in these columns when the window is opened. The history is determined as the data included in the last logfile.bdb file up to 28,000 lines.
Module – The module name of the traced data.
Priority – The priority of the statement. Colors are used to represent different priority levels.
Date and Time – Date and time that the activity occurred.
Message – Detailed message regarding the activity.
Message ID – The message's unique identification number.
Module ID – The module's unique identification number.
Thread ID – The thread identification number of the traced data. (This number is used by developers for troubleshooting.)

The left end of the status bar describes menu item actions as you use the arrow keys to navigate through menus. It also describes actions when you pause the mouse pointer over a menu item or toolbar button. The right area of the status bar displays the following information. To display or hide the status bar, on the menu bar, select View | Status Bar.
Items – Displays the number of records on the console.