
Reports
under construction
You can use the Report Designer to edit existing reports, as well as create your own reports from scratch. This topic describes the most basic tasks you may encounter when editing a report in the Report Designer.
To guarantee that you will be able to revert your report to its original state, you need to create a backup copy. Then, you can apply changes without worrying that it will be hard to restore your report in case something's broken.
To save a copy of your report, select File | Save, click the save toolbar button, or press CTRL+S. In this case, the report will be saved in the application's current folder. The path to your report will be displayed in the Report Designer's title bar.
You can freely move report elements, e.g. labels, by dragging them. Another way to change the element position is to select an element, and then press the arrow keys.
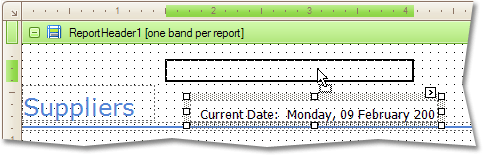
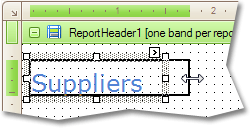
To resize an element, select it and then drag one of the small boxes shown on its edges and corners. To resize an element using keyboard shortcuts, press SHIFT+ARROW or CTRL+SHIFT+ARROW.
You can also easily align controls to each other or make them the same size, buy selecting multiple controls and using the Layout Toolbar.
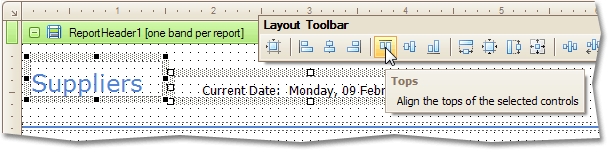
To select multiple controls, you can do one of the following.
Click controls while holding CTRL or SHIFT.
Click on a blank space and drag the mouse to create a selection frame. When the mouse button is released, all controls within the selection frame's boundaries will be selected. In this case, the previous selection is cleared.
 For information
on how to work with tables, see the Report
controls topic.
For information
on how to work with tables, see the Report
controls topic.
Reports display static and dynamic information. Dynamic information is something that changes through a report - values from a database (actual report data) or service information (such as current user name or page numbers). Static information is text or images that doesn't change through the report, and doesn't depend on the current computer. Such information can be printed only once (e.g. in a report header), can repeat on each page (e.g. in a page header) or can repeat with every entry in your report (a label describing your data).
If you need to change static information displayed by your report, simply locate the desired report element in the designer and invoke this element's smart tag. The smart tag will contain a link or a button allowing you to edit this element's content.
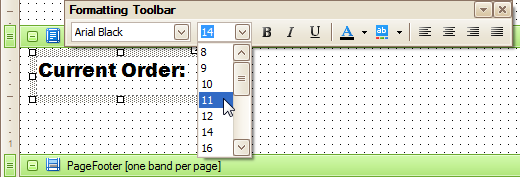
Text elements, such as labels and rich text boxes, also allow in-place editing of their content. Simply double-click an element and activate the editor. If you're working with rich text, you can use Formatting Toolbar.
To add information to your report, you need to use an appropriate element from the Control Toolbox, such as a Label, Rich Text Box or Picture Box. Once an element has been placed at the appropriate position, specify its content using the smart tag. For instance, the following instructions describe how to add a rich text box into your report.
Drop the Rich Text control from the Toolbox onto the Detail band.
Select the created control and click its Smart Tag. In the invoked actions list, click the Load File link.
In the dialog, define the path to an RTF or TXT file containing the text of the announcement, and click Open.
You can perform
additional text formatting using the Formatting
Toolbar.
To delete a report element (band or control), do one of the following:
Select the required element in the Design Panel or Report Explorer, and press DELETE. To select multiple elements, hold down the SHIFT key.
Right-click the required report element, and in the invoked Context Menu, choose Delete.
In the Main Menu, select Edit | Delete.
You can cancel the operation by pressing CTRL+Z.
Report elements can either display static information or dynamic data fetched from the bound database. Data-bound elements are indicated in the Report Designer using a little database icon in the top-right corner.
Sometimes you may work with a report that is missing some information. For instance, you may have an employee list that doesn't display birth dates. If the database contains this information, you can easily add it to your report using one of the methods described below.
To bind an existing report element, click the desired field item in the Field List window, and then drag and drop it onto the element. The yellow database icon inside the control will then appear.
To add a new data-bound report element, simply drag the desired field item from the Field List window onto a report band. This will create a Label bound to the selected data field.
A more flexible way to create data-bound elements is to right-click a Field List item, and then drag and drop it onto a report. This will invoke the context menu. Simply choose the element type that will represent your data, and it will be automatically created and bound to the selected data field.
Click an element's Smart Tag, and in the invoked menu, expand the Data Binding drop-down list and select the required data field.
Click an element to show it's properties in the Property Grid. Expand the (Data Bindings) branch that holds the bindable attributes. Specify a data field for the required attribute (e.g. Text).
To change value formatting, locate the required element, click its smart tag, and then click the ellipsis button next to Format String.
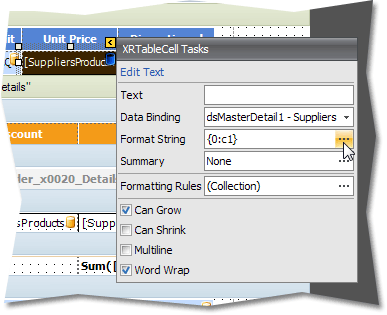
This will invoke the Format String Editor dialog, allowing you to choose one of the predefined formatting styles.
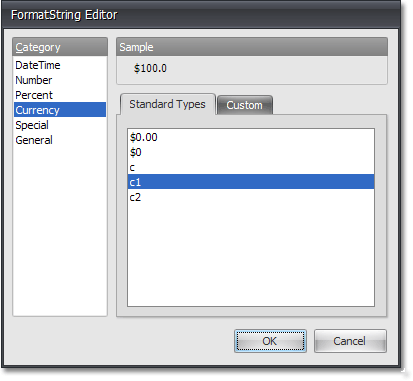
Select the required style and click OK, to close the dialog and save the changes.
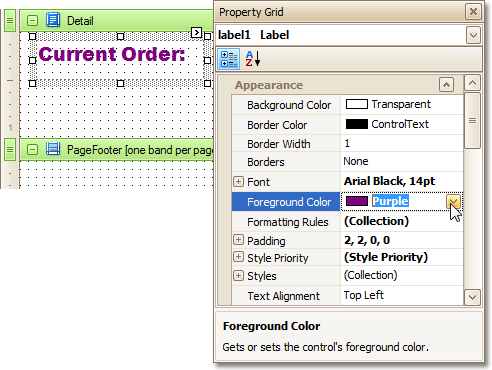
To change fonts and colors (as well as paddings, text alignment and other appearance properties) of a report control or band, select this element and do one of the following:
Use the Formatting Toolbar.
Use the Property Grid. Note that all appearance-related properties are located under the Appearance category.
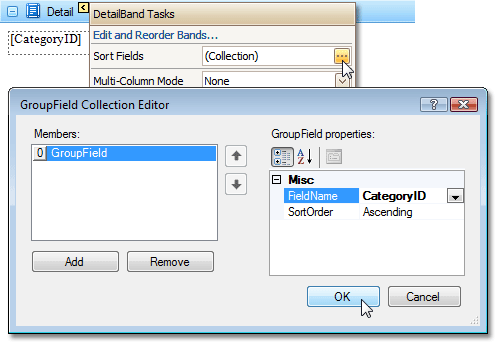
Use this procedure to sort a report's data. In this example, we use a report containing a Label control bound to a CategoryID data field. This field will be used as a sorting criteria.
Click the Detail band's Smart Tag, and in the invoked menu, click the Sort Fields ellipsis button.
In the dialog, click Add, to add a new entry, and set the FieldName property to a data field against which you want to sort your data. You can also define a sorting order (ascending or descending).
You can sort data against multiple data
fields. For this purpose, add more entries and specify their data field
and sort order settings.
To apply the settings and close the dialog, click OK. The report is now ready. Switch to the Preview Tab, and view the result.
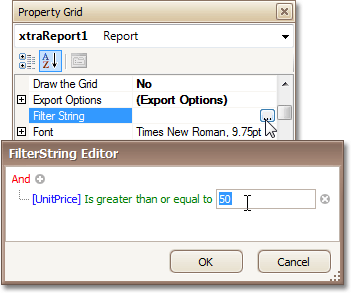
To filter a report's data, select the report, and in the Property Grid, click the Filter String ellipsis button. The FilterString Editor will appear, allowing you to easily define a required expression.
The report is now ready. Switch to the Preview Tab, and view the result.
It is also possible to request a filtering parameter each time a report is previewed. See Add Parameters to a Report for details.
This procedure demonstrates how to group a report's data. Note that data grouping can be performed only if a report is bound to a data source.
To group records in a report, follow the instructions below.
Add a Group Header band to the report.
For this, right-click anywhere over the report's surface, and in the invoked Context Menu, select Insert Band | GroupHeader.
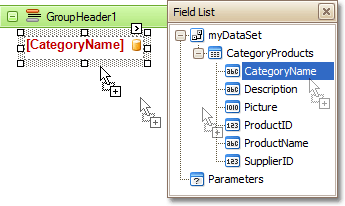
Drop a field, which will be used as a grouping criteria, from the Field List onto the created GroupHeader1 band.
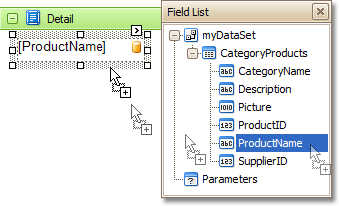
Drop a field, representing the general report's data onto the report's Detail band.
Click the Smart Tag of the GroupHeader1 band, and in the invoked actions list, click the ellipsis button in the Group Fields section. The GroupField Collection Editor dialog will appear.
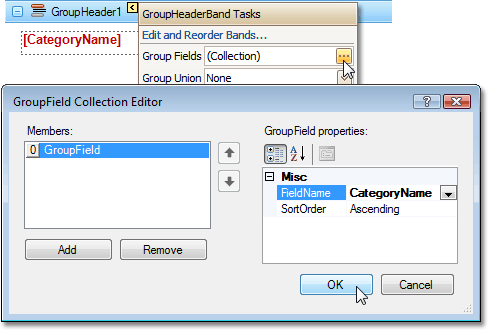
In this dialog, click Add, to add a new grouping field, and set its Field Name property to the required field.
 Also, you can define whether the sort
order for this grouping field should be ascending or descending, by using
the Sort Order property.
Also, you can define whether the sort
order for this grouping field should be ascending or descending, by using
the Sort Order property.
To apply the settings and close the dialog, click OK.
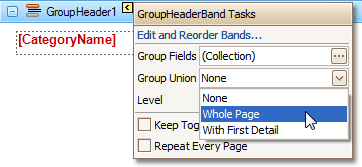
Again, click the GroupHeader1 band's Smart Tag, and in the Group Union drop-down list, select Whole Page, so that a report group starts on a new page if it doesn't fit entirely on the previous one.
The report is now ready. Switch to the Preview Tab, and view the result.
To calculate summaries (totals) within a report, follow the instructions below.
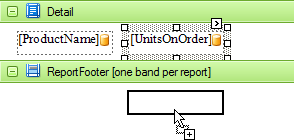
If the Report Footer band is not present in your report, add it. To do this, right-click anywhere over the report's area and in the invoked Context Menu, select Insert Band | Report Footer.
Click the field for which a summary will be calculated, to select it. Then, hold down CTRL and drag the field onto the Report Footer area, to create an exact copy of the Label that will display the summary.
You can also create a new label for your
total by simply dragging it from the Control
Toolbox.
Select the newly created Label, and in the Property Grid, click the Summary ellipsis button. The Summary Editor will appear.
The following image shows an example of how you can set up your total. Note that the Summary Running option is set to Report, to ensure that all values from the specified data field are taken into account.
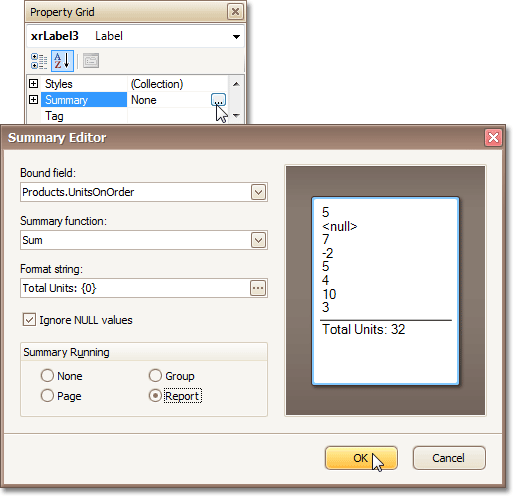
The Ignore NULL values option won't
affect the result in this example, since NULL values are treated like
zeros, by default. So, Sum won't change whether these values are taken
into account or not. This option makes sense for functions like Count
or Average, because the number of elements counted will depend on it.
To save the settings and close the dialog, click OK.
Switch to the Preview Tab, and view the result.
This procedure describes how to add a text watermark to a report, or turn a picture into a report's background. Note that watermarks are visible only in Preview and HTML View modes.
Follow the instructions below to create a new watermark in a report (or to modify the existing watermark, if it is already present in a report).
To select the report, click anywhere over the blank surface surrounding its bands area.
Then, in the Property Grid, click Watermark ellipsis button. The Watermark dialog will appear.
In this dialog's Text Watermark tab, define the required properties, such as Text, Direction, Color, Font, Transparency, Page Range, etc.
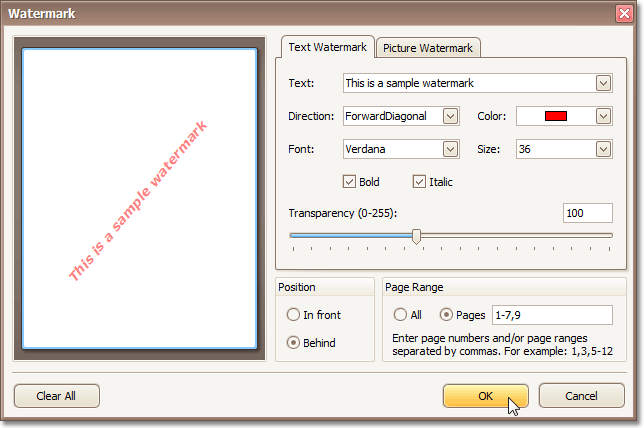
Then, switch to the Picture Watermark tab, to load an image to be used as a watermark, and define its properties, such as Size mode, Alignment (vertical and horizontal), Tiling, Transparency, Page Range, etc.
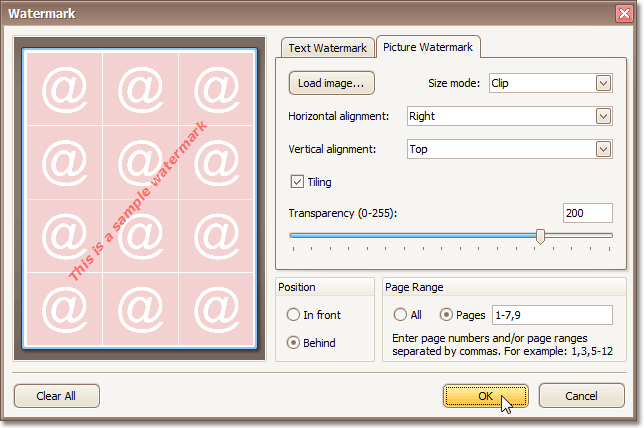
As you can see, it is possible to use both textual and image watermarks simultaneously.
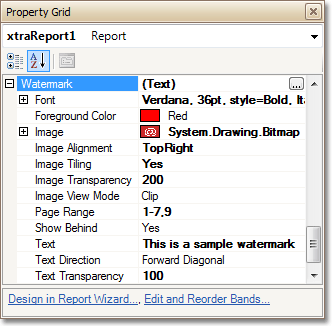
Note that you can define all the watermark options without invoking the dialog. For this, in the Property Grid, expand the Watermark property and set the required properties directly.
The report with watermark is now ready. Switch to the Preview Tab, and view the result.
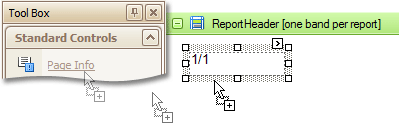
This procedure describes how to insert page numbers or other system information (e.g. current date and time, user name, etc.) into a report.
Generally, this information is displayed within the Page Header and Footer or Page Margin bands. To add page numbers or system information to a report, locate the Control Toolbox and drag and drop the Page Info control.
Follow the instructions below for your specific task:
Select the Page Info control, then in the Property Grid select the Page Information drop-down list. You can select whether to display only the page number (Latin or Roman - uppercase or lowercase) or the current page number of total pages.
Define a formatting to the control's text. In the Property Grid, set the Format property to Page {0} of {1}.
Select the Page Info control, then in the Property Grid select the Page Information drop-down list. Select Current Date and Time.
Also, you can define a formatting to the control's text, using its Format property.
Select the Page Info control, then in the Property Grid select the Page Information drop-down list. Select User Name.
Define a formatting to the control's text. In the Property Grid, set the Format property to Current User: {0}.
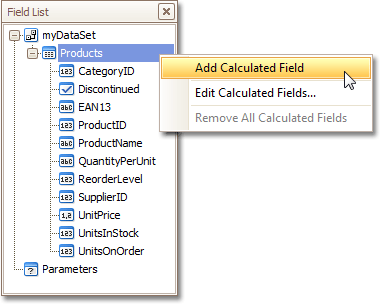
This procedure demonstrates how to add a calculated field to a report. The main purpose of calculated fields is to perform calculations over different data fields. To learn how to easily perform calculations within a single data field, refer to Adding totals to a report.
To add a calculated field to your report, follow the instructions below.
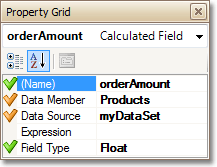
To create a calculated field, in the Field List, right-click any item, and choose Add Calculated Field.
In the Field List, select the created field to show its properties in the Property Grid. Change the Field Type property to an appropriate value.
Create an expression for the calculated field.
Click the ellipsis button in the Expression section. The Expression Editor will appear. You can also invoke this dialog by right-clicking your calculated field within the Field List and selecting Edit Expression...
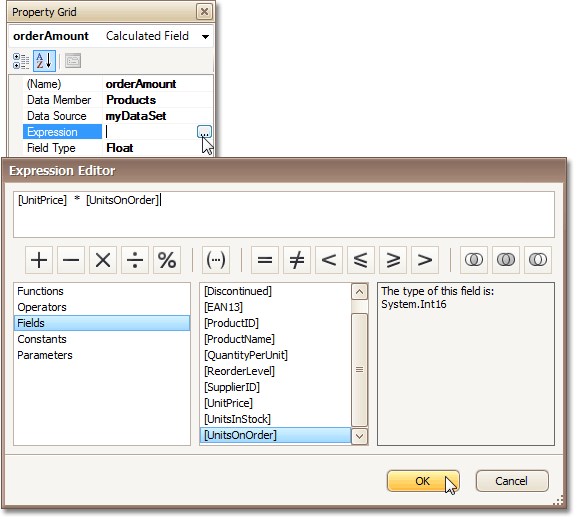
Click Fields to see the field list. Double-click field names to add them to the expression string. Use the toolbar to add operators between field names.
To close the dialog and save the expression, click OK.
Drag the calculated field from the Field List onto a control or a table cell.
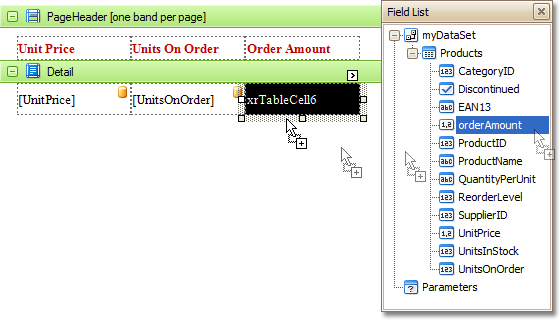
The report with a calculated field is now ready. Switch to the Preview Tab, and view the result.
Sometimes it's useful have parameters in your report. Parameters can help you filter your data or specify a value that will be used to calculate other values (in the latter case, use calculated fields).
To add parameters and filter your report based on their values, follow the steps below.
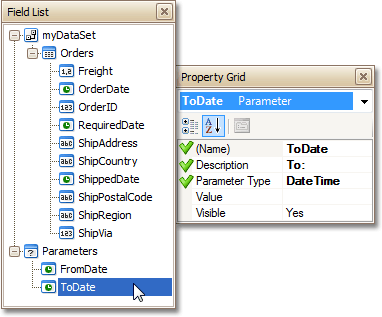
In the Field List window, right-click over the Parameters section, and click Add Parameter. Repeat this action to create the second parameter.
In the Field List, select the first parameter, and in the Property Grid, set its (Name) to FromDate, Description to From: and Parameter Type to Date Time. For the second parameter, set these properties as shown in the following image.
You have now created two report parameters. Every time you preview your report, you will be asked to enter their values. The following instructions explain how to use these values to filter your report's data.
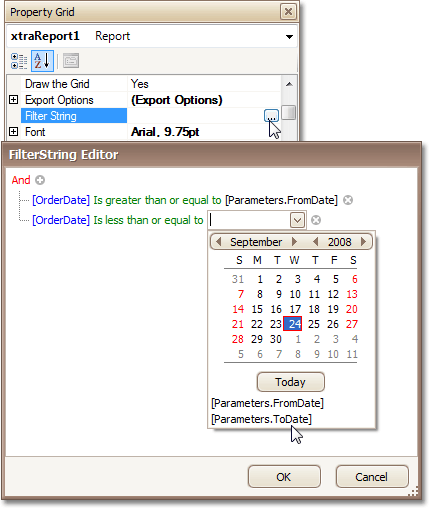
Select the report (by clicking anywhere over the blank space in the report designer), and in the Property Grid, click the Filter String ellipsis button. The FilterString Editor will appear. In this dialog, define the required expressions involving the created parameters.
Make sure that the report's Request Parameters property is set to Yes, as it is by default. Otherwise, the parameters won't be requested during the preview, and as a result, you'll get a blank report.
The parameterized report is now ready. Switch to the Preview Tab, and in the Parameters section, define the required values and click Submit.